7. Nutrition in Plants

1. The graph shows the rate of photosynthesis plotted against an unknown factor.   Which factor is limiting the rate of photosynthesis as shown in the graph?


2. The diagram shows a section through at least of a green plant.   During exposure to bright light, which region contents most starch?


3. The Diagram shows the part of the cross-section of a leaf. Which labeled structures convert light energy to chemical energy?


4. Plants use carbon dioxide and water to carry about photosynthesis. Which description is correct?


5. What uses stomata as its route into the leaf?


6. Which labelled has the function shown?
Cell Function
A 1 absorption of light
B 2 transport of sucrose
C 3 transport of water
D 4 synthesis of  carbohydrate


7. Which chemical change text place in the green plants but not in animals?


8. Some students in investigated gaseous exchange in a green plant. The rate of oxygen production was plotted against carbon dioxide concentration. What explains these results?


9. The diagram shows a section through a leaf. In which layer will there be no conversion of light energy of chemical energy?


10. The graph shows the rate of photosynthesis plotted against an unknown factor. which factor is limiting the rate of photosynthesis as shown in the graph?


11. Which equation summarises photosynthesis?


12. The graph shows the rate of photosynthesis at two different carbon dioxide concentrations and at varying light intensities at an optimum temperature of 25° C. Which factors are limiting at the points indicated?
Light Intensity Carbon Dioxide concentration
A 1 2
B 3 4
C 1 and 2 3 and 4
D 2 and 3 1 and 4


13. The diagram shows an investigation using an aquatic plant. What is the main gas present at Y?


14. The diagram shows a section through a leaf with four-layer of cells labeled. Which row shows the correct comparison between a layer where the cell contains more chloroplast and a layer where the cell contains fewer chloroplast?
Layer Where the cells contain more chloroplasts Layer Where the cells contain fewer chloroplasts
A 1 2
B 1 4
C 2 3
D 4 3


15. An investigation was carried out on the effect of light intensity on the rate of photosynthesis. Throughout the experiment, all other factors affecting photosynthesis work kept constant. The results are shown on the graph. 
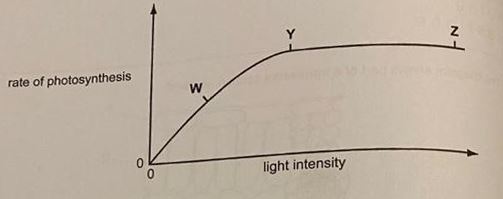
What do these results show?


16. The graph shows the effect of various factors on the rate of photosynthesis. Which factor is the limiting factor at X?  


17. The diagram shows part of a transverse section of a leaf. Which cells contain chloroplasts?


WhatsApp chat